Sending logs from AWS ECS using Logspout
When we first implemented Amazon EC2 Container Service (ECS) one of our key requirements was centralized logging. As we expand the number of services we run in our production and sandbox environments, it has become increasingly important to understand what’s happening with each service and the interactions between services. We also use a service, called Wombat, to collect events from our front end React applications. Wombat collects events which we use for monitoring, diagnostics, metrics, and which we also want to correlate with our backend services.
Logging Architecture Mark I
When we first built logging in ECS, we logged from individual services by using the awslog driver. The awslog log driver automatically logs events from your Docker containers running in ECS into AWS CloudWatch Logs. To do this individual Task Definitions had their log configuration setup like this:
|
|
We defined the awslog log driver and then specified options to control the destination of our logged events. To do this, we specify the log group inside CloudWatch Logs, then specify an AWS region, and a prefix to label our event stream. Our configuration would result in events being logged in the production-ecs group, in a stream named:
backend-app/app/d504031a-d3b7-4534-a999-72cb36d0d13b
Where backend-app is our prefix, app is the container name, and the trailing string is the ECS Task ID.
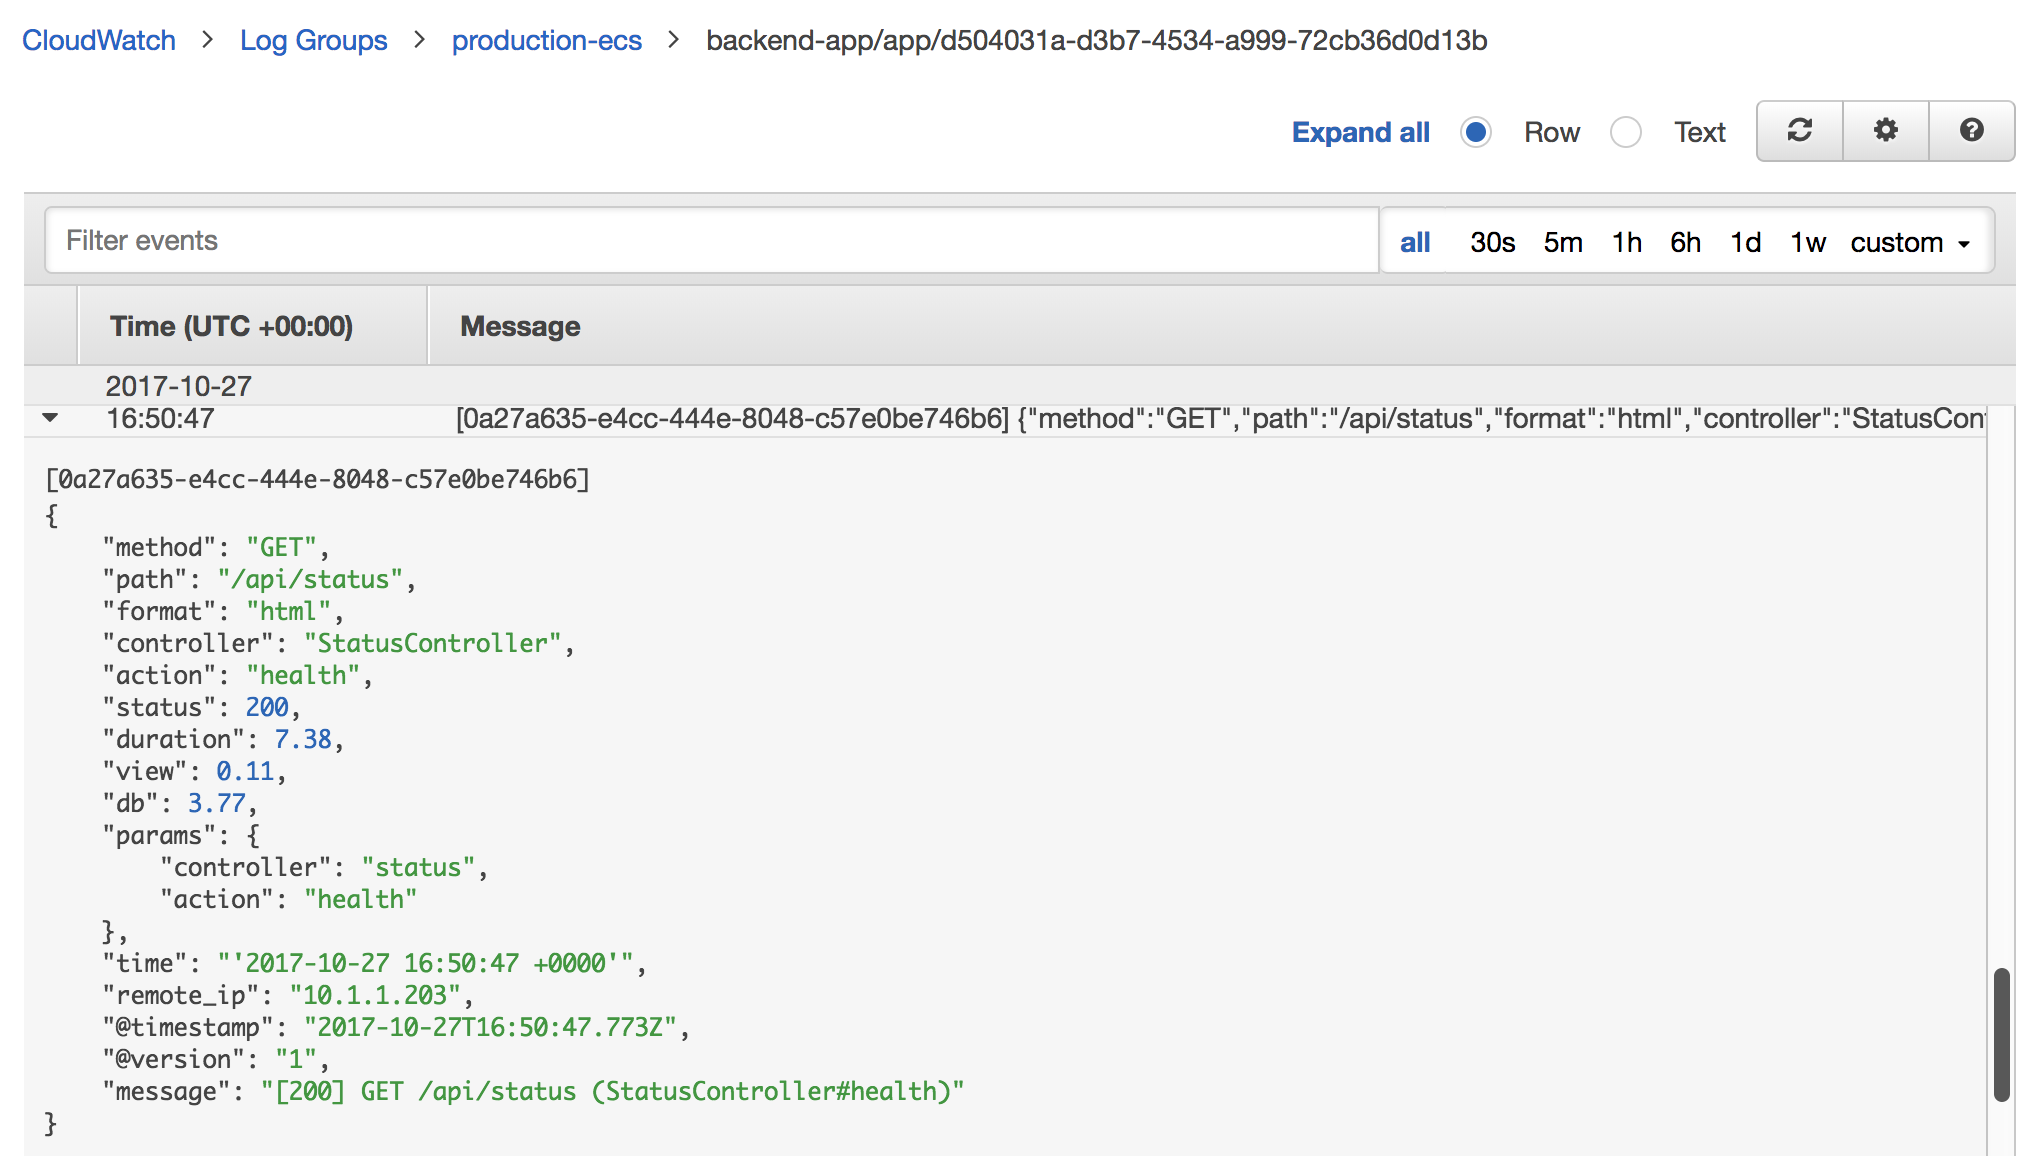
CloudWatch Logs itself has very limited capabilities. Other than viewing logs, which doesn’t include searching and only limited filtering, you can really only export the logs to S3, AWS Lambda or AWS Elasticsearch service. In light of this, we extracted the log events into Logstash for parsing and then sent them into Elasticsearch (using AWS’ hosted ES). We use Logstash because we have a varying collection of services in our stack and many events need to be parsed, formatted or standardized before being useful for our purposes.
To do this extraction we used the CloudWatch Logs Input. It uses the Ruby-based AWS SDK to retrieve events from the CloudWatch Logs API and send them into Logstash. Once inside Logstash we used various grok and related plugins to normalize and parse events and then exported them to Elasticsearch. We then put a Kibana front-end on top of this to allow us to query and dashboard events.
Unhappy
After being in production for a few months, we had a number of issues with the approach we’d taken.
- It required configuration of every Task Definition. If we wanted to change anything then we needed to change every definition.
- The CloudWatch Logs API tended to get throttled at high volumes.
- Some events would inexplicably not be extracted.
Additionally, CloudWatch felt like an added link in the chain that wasn’t required and felt a little like a blackbox to us.
Alternatives
So we decided we wanted to look at some alternatives. We broke each issue down and considered the priority of the concern and related requirements. Ultimately, given the potential expansion of services, we decided that 1) was the primary concern and driver for any potential change.
We did consider that we could fix 2) and 3) by switching to sending logs to S3 or to ELK via Lambda. But this still left CloudWatch in the loop and added more links, either a Lambda application or retrieving logs from S3 via another Logstash input plugin. This also didn’t resolve our primary issue of centralized configuration in the task definitions though.
Logging Architecture Mark II
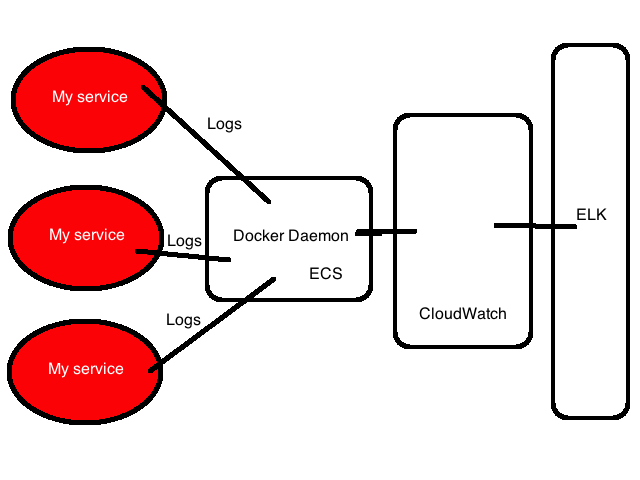
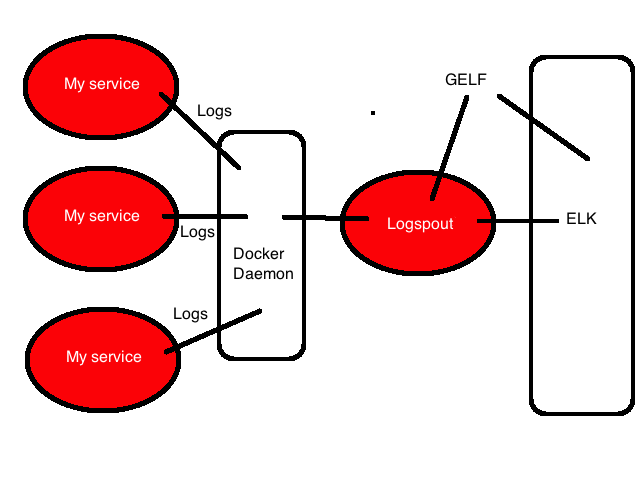
Ultimately, given the importance of centralized configuration, we decided that a logging container (or agent) on each Docker instance, collecting logs from each daemon was the most flexible approach. This allowed us to configure each task definition’s logging identically and placed all logging configuration in the agent.
Each container would be configured to use the json-file log driver, which collects logs as JSON events to files. The JSON log events could then be retrieved via the Docker Remote API.
We could also define the agent in a Task Definition and wrap that in an ECS Service. This takes care of running the required agents.
For the logging agent we decided to use Logspout. Logspout is a log router for Docker containers that runs inside Docker. It attaches to all containers on a host, then routes their logs to a destination. It’s written by the folks at Glider Labs, led by long time Docker ecosystem folk Jeff Lindsay. Logspout is modular and allows you to export logs in a variety of formats. Of these formats we chose Gelf. Gelf is Graylog’s default event format, it’s like an enhanced Syslog format. Gelf isn’t provided with Logspout but is included in a third-party module. We chose Gelf because it’s a good structured format that requires limited parsing (as opposed to say raw or syslog-based), compressible and Logstash can ingest it via an input plugin.
Gelf is also natively supported as a Docker log driver and we did consider adding the Gelf driver locally in each Task Definition. This did present other issues, the AWS ECS Docker daemons are configured to only support the awslog and json-file log drivers. We would have had to reconfigure all the Docker daemons to get this to work. Additionally, we’d need to place our Gelf-destination configuration in each Task Definition, again distributing our configuration and requiring changes to multiple definitions in the event we wished to change logging architecture again.
Let’s see how we built the rest of this architecture.
Logspout Task Definition
We start with the Task Definition for our Logspout service. We first add a volume for the Docker socket. We call this volume dockersocket and specify the file location: /var/run/docker.sock.
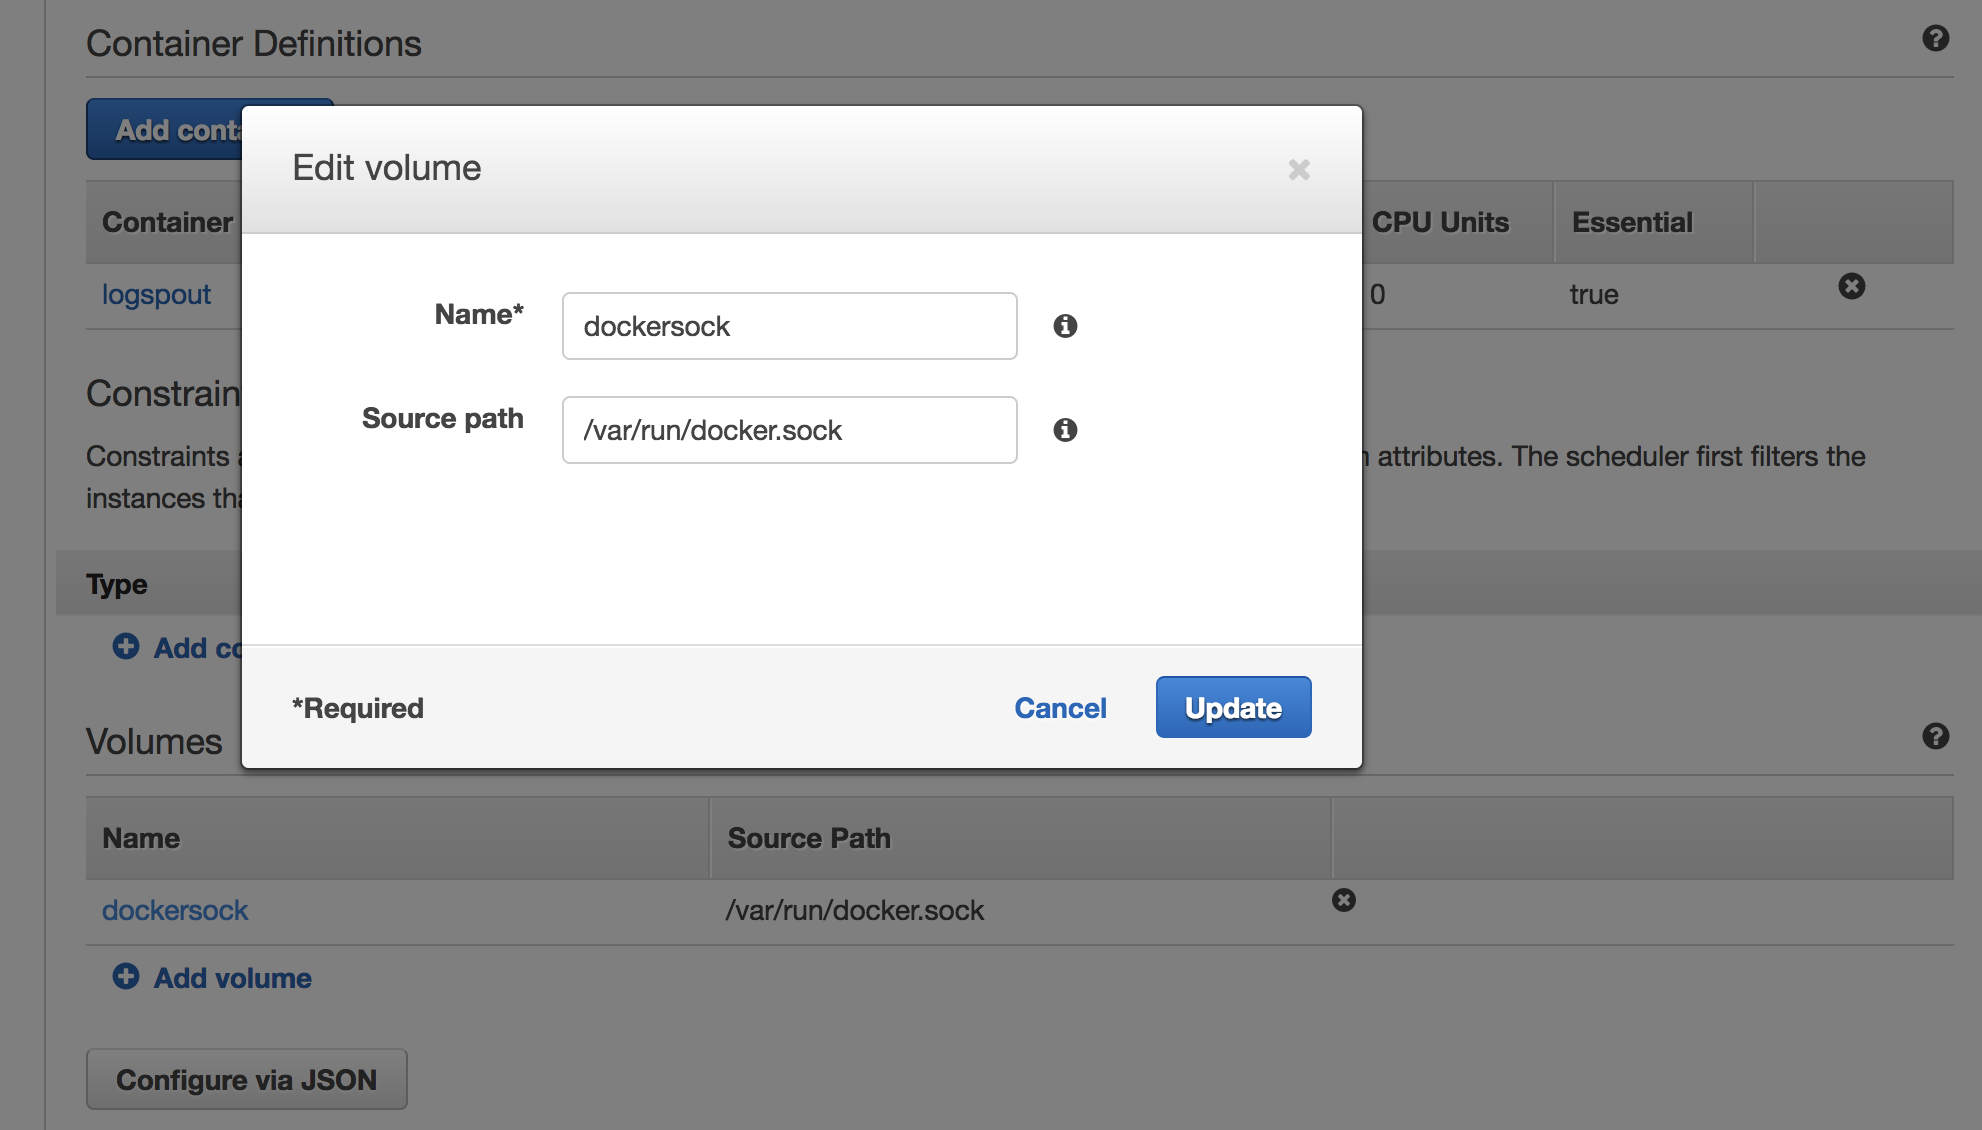
In a moment we’re going to mount this volume inside a container running the Logspout agent. The agent will use this socket to query the Docker Remote API for the logs.
We add a container called logspout that uses an image containing the Gelf-enabled Logspout agent.

The Logspout agent expects the container’s command to be the destination for the log entries. We specify our internal Logstash server, the Gelf format and port 12201: gelf://logstash.core:12201.

We also add the Gelf port 12201 to all the relevant security groups between ECS and our Logstash server.
Lastly, we mount the dockersocket volume inside our container.

Here’s most of the JSON from that task definition
|
|
You’ll note we keep this container logging to CloudWatch, just in case something goes wonky and we need to see what happened to the Logspout agent without worrying that our logs might get swallowed somewhere.
Logspout service
We then create a Logspout service using this definition. This is where things get a little annoying with ECS. ECS doesn’t have an easy way to ensure that task dynamically run on all instances in a cluster.
What ECS does have though is the distinctInstance placement constraint. If we specify the number of tasks to run equal to the number of instances in the cluster and specify this constraint then ECS will distribute a task onto each instance. But this need to specify the right number of instances in the cluster is annoying and especially annoying if you’re auto-scaling the cluster.
To solve this we could do our service creation programmatically by querying the number of instances in the cluster and using that number to automatically build or update a service with the right number of tasks. For now though we’re happy to use the number.
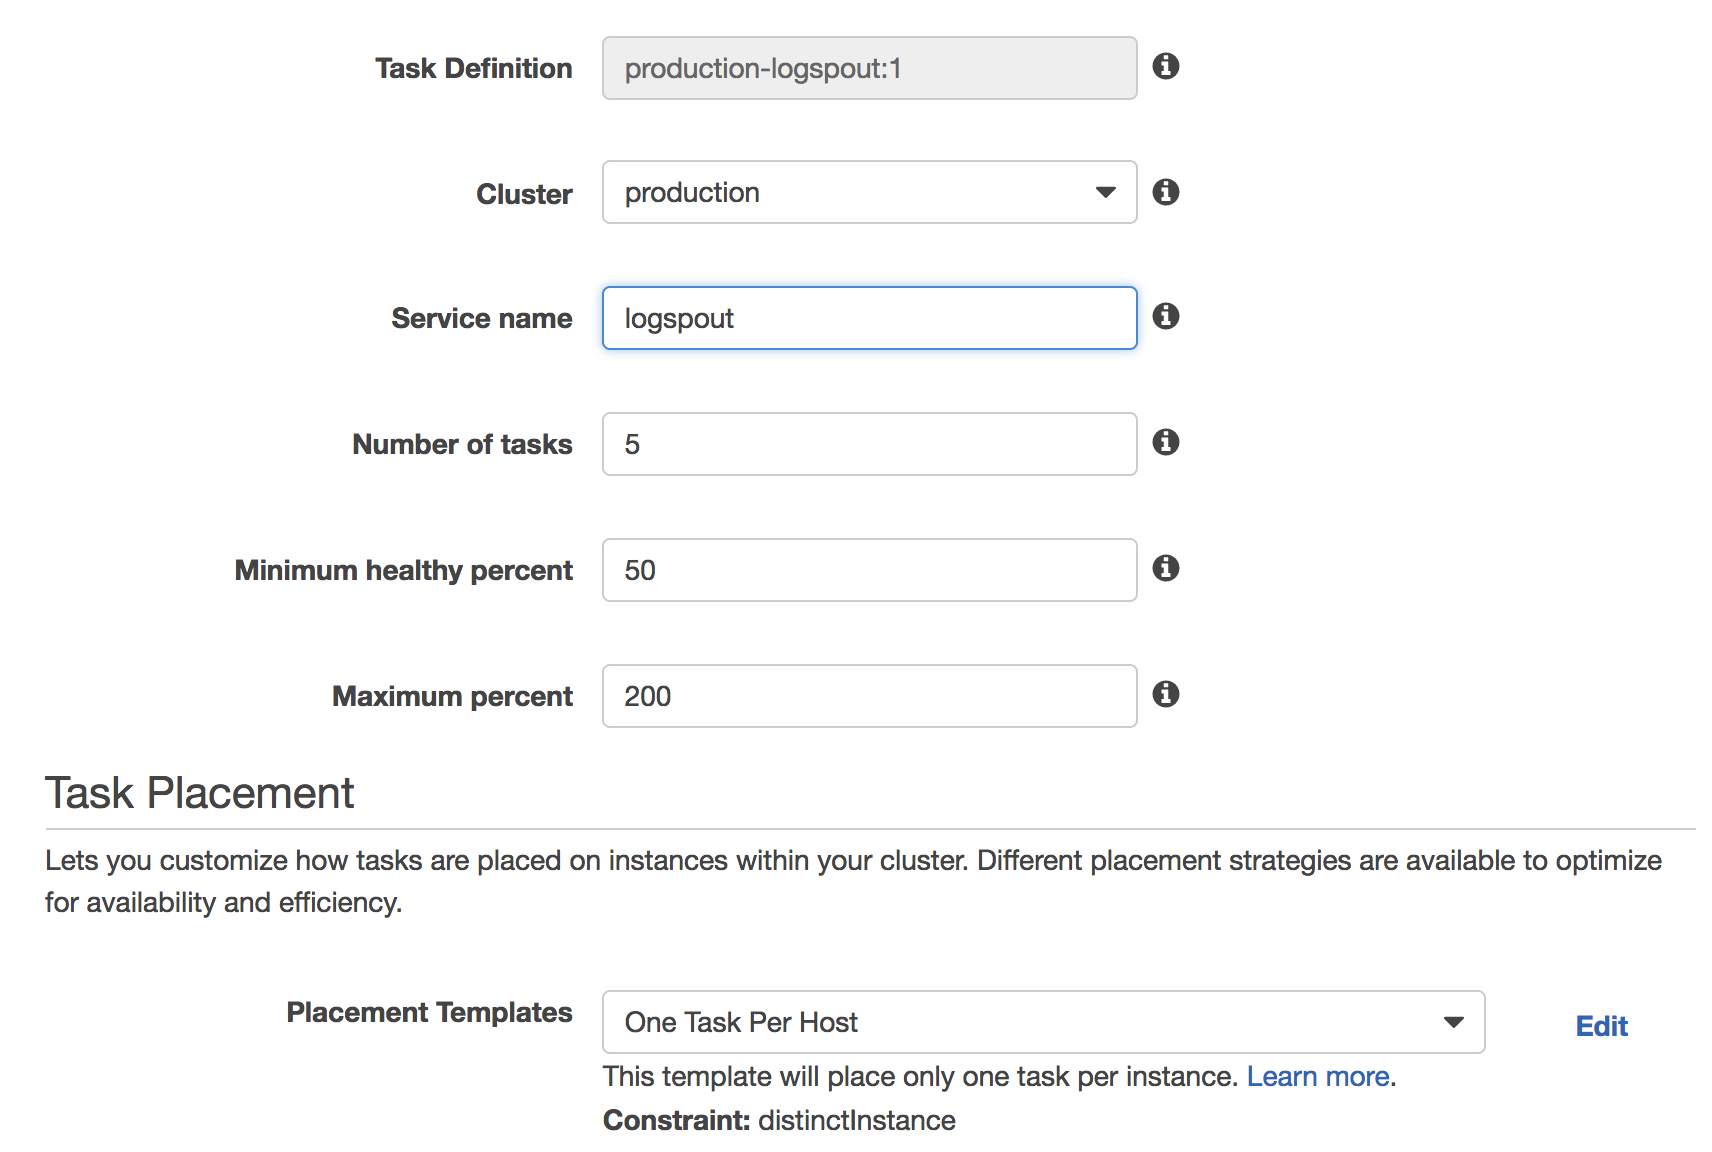
So we specify 5 tasks, in our case we have 5 instances in the production cluster, and the One Task per Host Placement Template.
(We could also use the ECS startup configuration for each cluster to always launch an agent. But that means managing non-stock configuration for clusters which is (more) annoying.)
We can now launch this service in each cluster and our logs will start to flow through to Logstash in Gelf-format.
Other task definitions
Next, each of our task definitions needs to be updated to move them from the awslog log driver to the json-file log driver.
|
|
This will send our events to JSON files and we can then retrieve them via the Docker Remote API.
Logstash
Finally, on the Logstash end, we need the Gelf input and some configuration. On our existing ELK server we install the Gelf input plugin.
|
|
And add a snippet of input code to our Logstash configuration file.
|
|
This enables the Gelf input and assigned a type of ecs to any incoming logs. We can then use the event type to process and parse any incoming logs, for example turn the container_name field into the environment (named for the cluster), service and specific container (the second block handles logs from the ecs-agent itself).
|
|
The Gelf input also has a variety of other fields present, including our logging payload in the message field.
Final thoughts
That leaves us with our updated log architecture in place. It’s still not perfect and it requires some fiddling to configure and setup. It does feel more robust and easier to manage than our previous solution though.
We hope this walkthrough is useful to someone and we’d be interested in seeing how others implement centralized logging on ECS.