Using Riemann for Fault Detection
In the last post I introduced you to Riemann. I mentioned streams in that post and how they are at the heart of Riemann’s power. However I only provided a vague teaser of streams and left you having to go fish for yourself.
In this post I’m going to build on our example Riemann configuration. I’ll show you how to do simple service management with streams and introduce you to Riemann’s state table: the index. We’ll see:
- How the index works.
- How we can alert on services and hosts using events.
- How we can send those alerts via email and PagerDuty.
Configuring Streams
Streams are specified in Riemann’s Clojure-based configuration file. On our example Ubuntu host we can find that file at /etc/riemann/riemann.config. We edited that configuration in the last post to bind Riemann to all interfaces and to add some more logging. Let’s look at it again now.
|
|
In our configuration we can see a section called (streams. Inside this section is where we configure Riemann’s streams. The first entry in this section specifies a default time to live for events. More on this shortly. The second entry tells Riemann to index all events.
The Riemann Index
The index is a table of the current state of all services being tracked by Riemann. In the last post, when we introduced events, we discovered that each Riemann event is a struct that can contain one of a number of (optional) fields including: host, service, state, a time and description, a metric value or a time to live. Each event you tell Riemann to index is added and mapped by its host and service fields. The index retains the most recent event for each host and service. You can think about the index as Riemann’s worldview. The Riemann dashboard, which we also saw in the last post, uses the index as its source of truth.
Each indexed event has a Time To Live or TTL. The TTL can be set by the event’s ttl field or as a default. In our configuration we’ve set the default TTL to 60 seconds with the default variable. This is the period for any event which doesn’t already have a TTL.
After an event’s TTL expires it is dropped from the index and fed back into the stream with a state of expired. This seems pretty innocuous right? Nope! This is where the change in monitoring methodology that Riemann facilitates starts to become clear (and exciting).
Detecting down services
In the last post I talked a bit about pull/polling models versus push models for monitoring. In the monitoring “pull model” we actively poll services, for example using an active check like a Nagios plugin. If any of those services failed to respond or returned a malformed response our monitoring system would alert us to that. This active monitoring generally results in a centralized, monolithic and vertically scaled solution. That’s not an ideal architecture.
In an event-driven push model we don’t do any active monitoring. Our services generate events. Those events are pushed to Riemann. Each event has a TTL and the last event received is stored in the index. When the TTL expires Riemann will expire the event and feed it back into the stream. In that stream I can then monitor for events with a status of expired and alert on those. A much simpler, more scalable and IMHO more elegant solution.
So let’s see how this might work for a service. In the last post we looked at some of the Riemann tools for service checking. Let’s use the riemann-varnish tool again for our testing.
On our Varnish host we need to install riemann-tools via RubyGems.
|
|
We can then use riemann-varnish to send our events.
|
|
The riemann-varnish command wraps the varnishstat command and converts Varnish statistics into Riemann events, for example the client connections accepted metric generates an event like so:
|
|
We can see that the event has a host and a service, the combination of which Riemann will use to track state in the index. The event also has a state field of ok plus other useful information like the actual client connections accepted metric.
We’re going to use this data, plus the TTL, to do basic service monitoring with Riemann. Let’s update our configuration to
|
|
The first thing we’ve added is a function called email that configures the emailing of events. Under the covers Riemann uses Postal to send email for you. This basic configuration uses local sendmail to send emails. The From email will be riemann@example.com. You could also configure sending via SMTP. To send emails you’ll need to ensure you have local mail configured on your host. To do this I usually install the mailtools package.
|
|
If you don’t install a suitable local mail server then you’ll receive a somewhat cryptic error in your Riemann log along the lines of:
riemann.email$mailer$make_stream threw java.lang.NullPointerException
Next we’ve used a helper shortcut called changed-state to monitor for events whose state has changed. The init variable specifies the base assumption of an event’s state, here ok. This is because Riemann doesn’t know about the previous state of events when it starts. This tells Riemann to assume previous events are all okay. Now the changed-state shortcut will match any events whose state is not ok and pass them to the email function we defined earlier.
Let’s see this in action. First, we need to restart or HUP Riemann. Next, whilst I’ve been explaining this, the riemann-varnish tool has been sending events to Riemann. Those events are from my Varnish host, varnish.example.com, and an event is generated by each Varnish metric. Each event has a state of ok and a TTL of 10 seconds.
|
|
If Varnish fails or I stop the riemann-varnish tool then the events flow will cease. When the TTL has expired, 10 seconds later, this should trigger an event with a state of expired and email notifications telling us that the Varnish services have changed state.
If we check our Riemann log file we should see the following event.
|
|
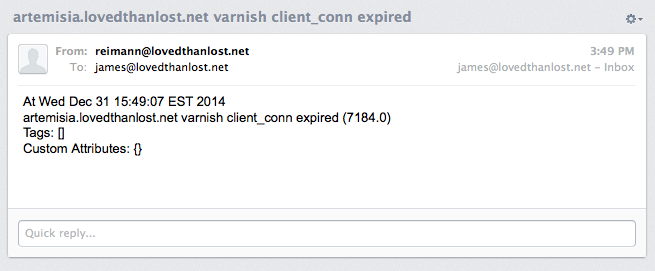
As well as additional events for each Varnish metric that has also expired. If we check our inbox we should also see email notifications for each service that has stopped reporting.

If the service starts working again you’ll receive another set of notifications that things are back to normal.
Preventing spikes and flapping
Like most monitoring systems we also have to be conscious of the potential for state spikes and flapping. Riemann provides a useful variable to help us here called stable. This variable allows us to specify a time period and event field, like the state (or usefully the metric for certain types of monitoring), and it monitors for spikey or flapping behavior. Let’s add stable to our example.
|
|
Here we’ve specified the stable variable with a time period of 60 seconds watching the state of events. This will mean that Riemann will only pass on events where the state remains the same for at least 60 seconds. Hopefully avoiding service flapping. (Also potentially interesting here is the ability to rollup and throttle event streams.)
Sending events to PagerDuty
We aren’t limited to email either for alerting. Riemann comes with some additional options, most notably PagerDuty.
|
|
Here we’ve defined a function called pd that creates a connection to PagerDuty. We’ve specified a service key we previously defined in PagerDuty. We’ve updated our state monitoring to trigger in two cases:
- When an event has a state of
expiredwe send an alert trigger to PagerDuty. - When an event has a state of
okwe send a resolution signal to PagerDuty.
This ensures we can both trigger and resolve issues created from Riemann.
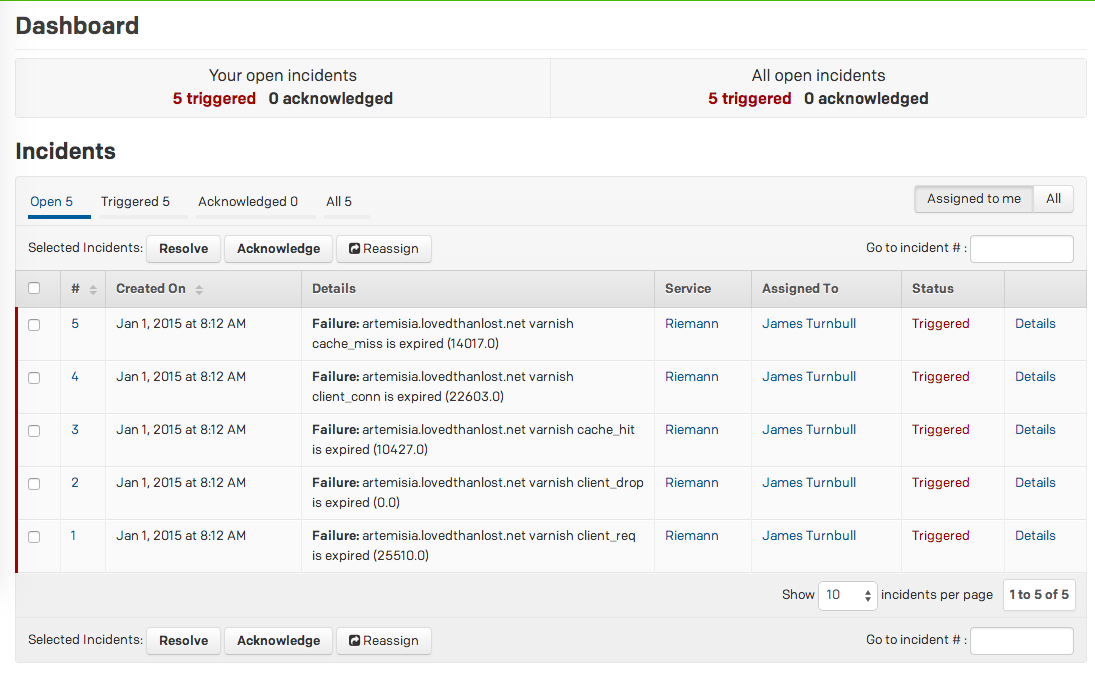
Let’s trigger some PagerDuty alerts. First, we need to restart or HUP Riemann to update our configuration. Next, we can generate some alerts by stopping our riemann-varnish tool again. The expired events should trigger some PagerDuty alerts like these.

Summary
Pretty cool stuff eh? Well this post just scratches the surface of things you can do with Riemann streams. There are a bunch of other ideas and examples in the Riemann HOWTO section that you can explore. Also look out for my next post on Riemann where I’ll be looking at streams again, this time with a focus on metrics and Graphite.