An Introduction to Riemann
If only I had the theorems! Then I should find the proofs easily enough - Bernard Riemann
For the last year I’ve been using nights and weekends to look to a variety of monitoring and logging tools. For reasons. I’ve spent a lot of hours playing with Nagios again (some years ago I wrote a book about it) as well as looking at tools like Sensu and Heka. One of the tools I am reviewing and am quite excited about is Riemann.
Riemann is a monitoring tool that aggregates events from hosts and applications and can feed them into a stream processing language to be manipulated, summarized or actioned. The idea behind Riemann is to make monitoring and measuring events an easy default. Riemann also provides alerting and notifications, the ability to send events onto other services and storage and a variety of other integrations. Overall, Riemann is fast and highly configurable. Most importantly however it is an event-centric push model.
So why does this matter? Most monitoring systems I’ve been examining are pull or polling-based systems like Nagios where your monitoring system queries the components being monitored. A classic (perhaps even traditional) check might be an ICMP-based ping of a server. This type of polling is focused on measuring uptime and availability. There’s nothing fundamentally wrong with wanting to know that assets are available and running. Except if that’s the only question you ask. Then it reinforces the view of IT as a cost center.1 Everything in the IT organization tends to be focused around minimizing downtime rather than maximizing value.
Push based models in comparison are generally about measurement. You still get availability measurement but as a side effect of measuring components and services. The push model also introduces some changes in the way monitoring is architected. Monitoring is no longer a monolithic central function and we don’t need to vertically scale that monolith as hosts are added. Instead pushes are decentralized and the focus is on measuring your applications, your business and your user experience. This changes the focus inside your IT organization towards measuring value, throughput and performance. All levers that are about profit rather than cost.2
So with this in mind, let’s take a look at installing Riemann, configuring it and doing some basic service and event monitoring.
Introducing Riemann
Riemann is open source and licensed with the Eclipse Public license. It is primarily authored by Kyle Kingsbury aka Aphyr.3 Riemann is written in Clojure and runs on top of a JVM.
Installing Riemann
We’re going to install Riemann onto an Ubuntu 14.04 host. We’re going to use the Riemann project’s DEB packages. Also available are RPM packages and tarballs. I am going to do a manual install so you can see the steps involved but you could also install Riemann via Docker, Puppet, Vagrant, or Chef.
First, we’ll need Java and Ruby installed. The Java to run Riemann
itself and Ruby for some supporting libraries, a client and the Riemann
dashboard. For Java we’re going to use the default OpenJDK available on
Ubuntu. For Ruby we’re going to install the ruby-dev package which
will drag in Ruby and all the required dependencies we need. We also
need the build-essential package to allow us to compile some of the
Ruby dependencies.
|
|
Then let’s check Java is installed correctly.
|
|
Now let’s grab the DEB package of the current release.
|
|
And then install it via the dpkg command.
|
|
The Riemann DEB package installs the riemann binary and supporting
files, service management and a default configuration file.
Lastly, let’s install some supporting tools, the Riemann client and dashboard.
|
|
Running Riemann
We can run Riemann interactively via the command line or as a daemon. If we’re running it as a daemon we can use the Ubuntu service management commands:
|
|
Let’s start though with running it interactively using the riemann
binary. To do this we need to specify a configuration file. Conveniently
the installation process has added one at /etc/riemann/riemann.config.
|
|
We can see that Riemann has been started and a couple of services have
been started: a Websockets server on port 5556 and TCP and UDP servers
on port 5555. By default Riemann binds to localhost only.
The default configuration on Ubuntu logs to
/var/log/riemann/riemann.log and you can also follow the daemon’s
activity there.
Configuring Riemann
Riemann is configured using a Clojure configuration file, by default on
Ubuntu it is available at /etc/riemann/riemann.config. Let’s take a
quick look at the default file.
|
|
We can see the file is broken into a few stanzas. The first stanza sets
up Riemann’s logging to a file: /var/log/riemann/riemann.log. The
second stanza controls Riemann’s interfaces: binding TCP, UDP and
Websockets interfaces to localhost by default. Let’s make a quick
change here to bind these interfaces to all available networks.
|
|
We’ve updated the host value from 127.0.0.1 to 0.0.0.0. This means
if one of your interfaces is on the Internet then your Riemann server is
now on the Internet. If you’re worried about security you can also
configure Riemann with
TLS.
The remaining sections configure indexing and streams. Streams are a big part of why Riemann is very cool. Streams are functions you can pass events to for aggregation, modification, or escalation. Streams can also have child-streams that they can pass events to, allowing filtering or partitioning of the event stream. Using streams is amazingly powerful and you can find sample configurations and a wide variety of howtos on the Riemann site.
Let’s make a small change to our streams stanza to output events to
STDOUT and our log file. Add the following at the bottom of the file
after all of the other stanzas.
|
|
The prn prints all events to STDOUT and the #(info %) sends events
to the log file. Now restart Riemann to enable our new configuration.
Sending data to Riemann
Riemann has a variety of ways you can send data to it including a set of
tools and a variety of client native language bindings. You can find a
full list of the clients here and
we’ll see how to use a client below. The collection of tools are written
in Ruby and available via the riemann-tools gem we installed above.
Each tool ships as a separate binary and you can see a list of the
available tools
here. They
include basic health checks, web services like Apache and Nginx, Cloud
services likes AWS and a variety of others. The code is clear and you
could easily extend or adapt these to provide a variety of other
monitoring capabilities.
The easiest of these tools to test is riemann-health. It sends CPU,
Memory and load statistics to Riemann. Open up a new session and launch
it now.
|
|
You can either run it locally on the same host you’re running Riemann on
or you can point it at a Riemann server using the --host flag.
|
|
Remember the default Riemann is only bound to localhost but we updated
our configuration to bind to all interfaces.
Now let’s look at our incoming data. Let’s start with looking at the Riemann log file.
|
|
Here we can see a couple of events, one for disk space and another for load. Each Riemann event is a struct. Each event can contain one of a number of optional fields including: host, service, state, a time and description, a metric value or a TTL. They can also contain custom fields.
Let’s examine one of the disk events riemann-health has sent:
|
|
We can see the event has a host, service, and state. If we peek over at the code that produced the event we can how it is generated and sent. As event APIs go it’s very lightweight but still hugely extensible.
Let’s try another tool, riemann-varnish, which reports Varnish
metrics. On one of my hosts with Varnish installed I run.
|
|
And on the Riemann host I see in /var/log/riemann/riemann.log.
|
|
And to drill down to a specific event.
|
|
Here we can see the Varnish client connections accepted metric. If we
look at the riemann-varnish
code
we can see a shell-out to varnishstat that captures our metrics and
sends them to Riemann. Pretty easy to replicate for a variety of
services.
If you think the shell-out and parse is a little clumsy then we can also write our own tool or use the Riemann client directly. Let’s embed Riemann into a Sinatra application.
|
|
Our Sinatra app is very basic. It responds on / with the HTML:
<h1>This does something awesome</h1>. As part of that connection it
also sends an event to Riemann using the Riemann client we installed
earlier.
To do this we’ve required the riemann/client and inside the
send_event method we’ve connected to the Riemann host on localhost.
This method then accepts a metric, which is a random number created by
the rand method, from the get block and sends that metric with an
event.
If we run this app (you might need to gem install sinatra to install
Sinatra first).
|
|
And then look at our Riemann logs we’ll see an event much like this:
|
|
Displaying Riemann events
Obviously reading events from the log output isn’t overly practical or
useful. To allow you to work with your events Riemann comes with a
dashboard. It’s a Sinatra application and we already installed it via
the riemann-dash gem.
Let’s start it now.
|
|
You can then view it on port 4567 on the localhost. You can also
change the dashboard’s configuration by creating a config.rb
file
in the directory from which you’ve launch the dashboard. This provides
control over where and how the dashboard binds and some other
configuration options.

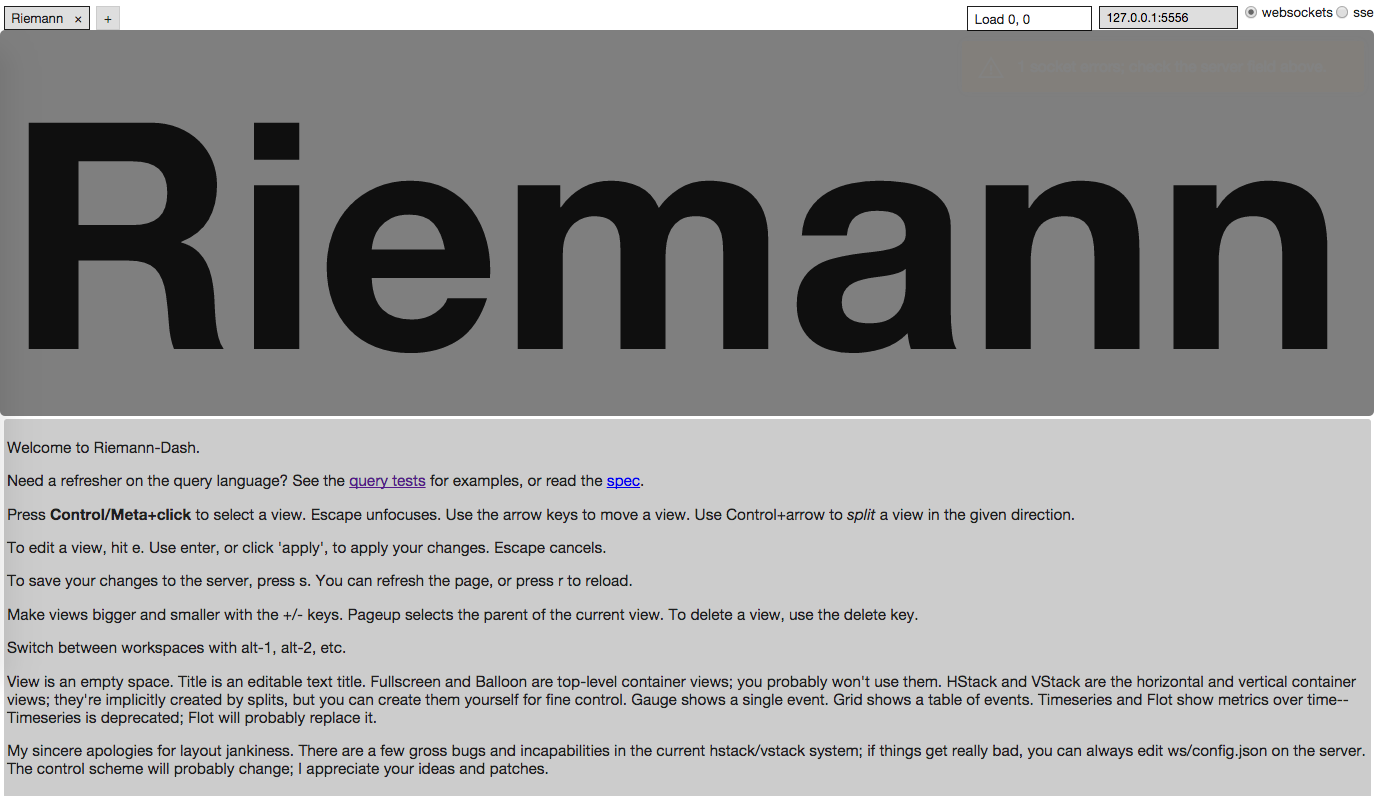
The dashboard is a little janky in places but can produce some excellent dashboards. The dashboard is made up of view panels that are configurable. You can select or add a view using the boxes and plus symbol in the top left of the dashboard.
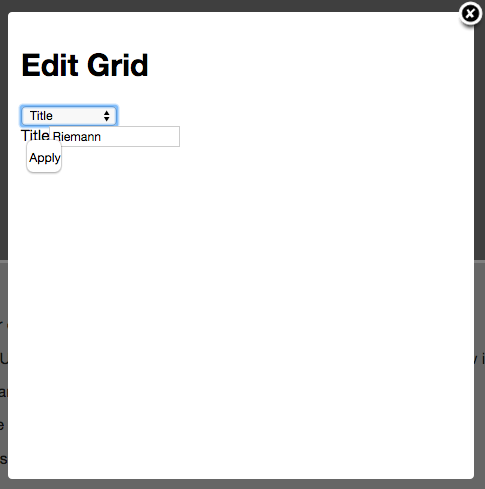
We just want to see the events coming into our dashboard though. So let’s edit our current view to show those events. First, Ctrl-Click (or Meta-Click on OSX) on the big Riemann title in the centre top of the dashboard to select this view. This will highlight it gray (The Escape key de-selects the view). Now type “e” to edit the view.

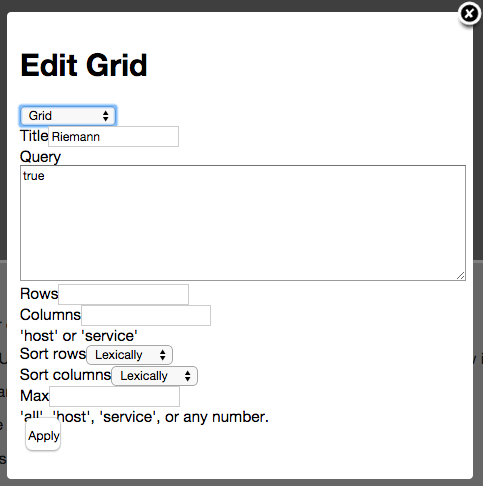
Change the view from Title to Grid and then put true into the
query box.

This will change this view into a grid, which shows a table of events,
and select all events, the true in the query box. This is the simplest
query you can create but you can do much more. To get started you can
find some sample queries
here).
Now you should see some of the events you’re generating displayed in a per-host grid.

If you’re not taken with the Riemann dashboard there is a Grid layout alternative or for graphing you could direct all your metrics to Graphite which has a very fully-featured dashboard.
Summary
We’ve barely scratched the surface of Riemann’s capabilities with this introduction. From here we could configure a variety of streams, matching events by service or host, and convert our events into summaries, metrics and collections.4 We can take alerting actions (email, PagerDuty) based on everything from failed services (replace Nagios anyone?), to metric thresholds, or even Holt-Winters anomaly detection. We can also send data onto longer-term storage or into other tools like Graphite. The Riemann HOWTO has a number of examples and ideas to help you build your Riemann environment further. I really recommend taking a look at Riemann if you’re interested in where modern monitoring is headed.
-
It also tends to reward conservatism and fear of change. ↩︎
-
This is a highly simplistic analysis of the potential for change in IT monitoring behaviour. Your mileage may vary. ↩︎
-
Kingsbury also published an excellent series on the CAP properties of a variety of distributed systems. ↩︎
-
Of couse there’s even a Puppet Riemann report processor. ↩︎