Monitoring Survey - Metrics
In the last posts I talked about the primary tool people used in monitoring and the demographics of the survey. In this post I am going to look at the questions around collecting metrics and what those metrics are used for by respondents.
As I’ve mentioned in previous posts, the survey got 1,016 responses of which 866 were complete and my analysis only includes complete responses.
This post will cover the questions:
6. Do you collect metrics on your infrastructure and applications?7. If you collect metrics, what do you use the metrics you track for?Collecting Metrics
Question 6 asked if the respondents collected metrics. Metrics are often an afterthought in monitoring environments, a side-effect of collecting binary on/off status detection. The more recent focus on them, from organizations like Etsy (the “Church of Graphs”) for example, has pushed them into the limelight. I was specifically interested to see how far this uptake has extended.
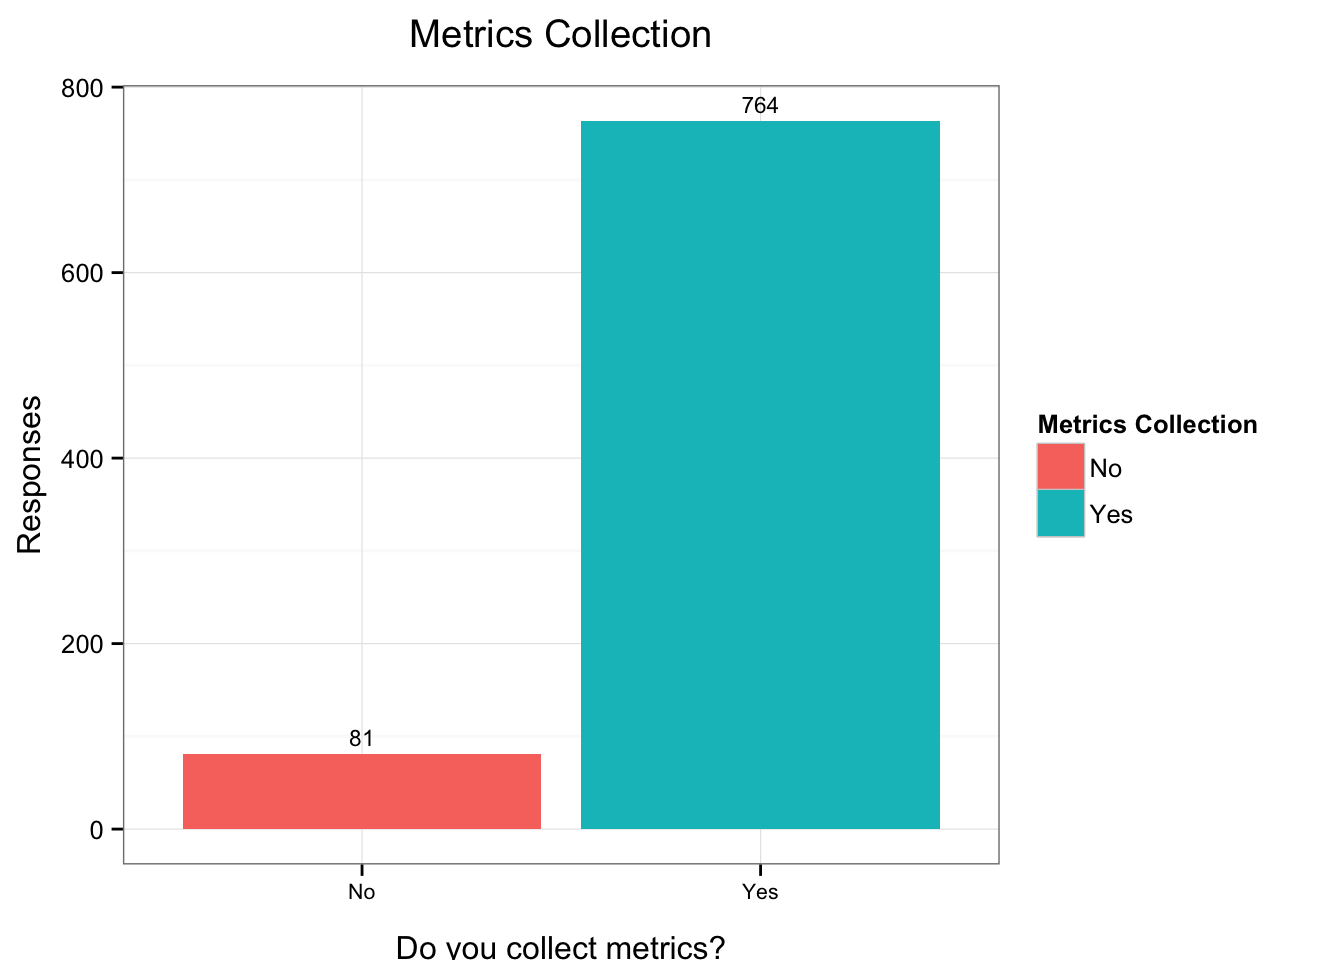
We can see that the overwhelming majority, 90% in fact, of respondents collect metrics. That seems pretty conclusive.
I also broke the responses down by organization size. I was curious to see what size organizations collected the least metrics.
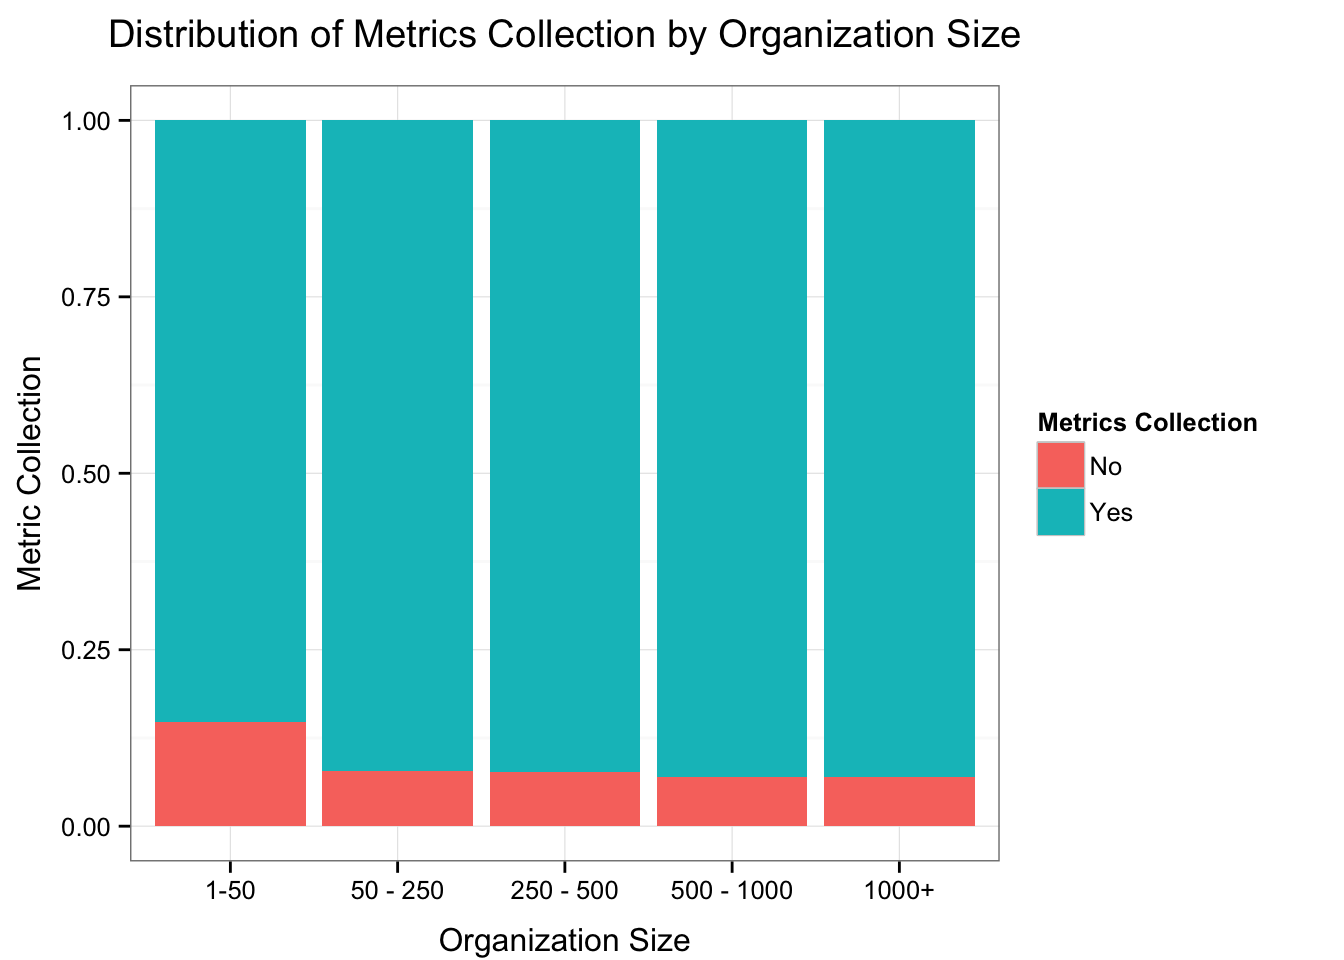
We can see that there is a slightly higher percentage of 1-50 person organizations who do not collect metrics. I suspect this is broadly a sign of monitoring immaturity.
The purpose of metrics collection
I also asked respondents why they collected metrics. I was curious whether respondents were collecting data for performance analysis, which has been the traditional reason to collect metrics. Or, alternatively whether people are collecting metrics as a fault detection tool. There’s a strong movement in more modern monitoring methodologies to consider metrics a fault detection tool in their own right. I was interested to see if this thinking had spread very far. Obviously, as I discussed in earlier posts, there’s likely to be some selection bias towards this more modern methodology in the community in which I seeded the survey.
Respondents were able to select one or more choice from the list of:
- Performance analysis
- Fault detection
- Trending
- Anomaly detection
- We don’t collect metrics
- Other
If respondents selected “No”, that they did not collect metrics, in the previous question logic skipped them to the next question.
I’ve produced a summary table of respondents and their selections.1
| Metrics Purpose | % / Count |
|---|---|
| Performance analysis | 74% (642) |
| Fault detection | 63% (547) |
| Trending | 58% (504) |
| Anomaly detection | 48% (415) |
| We don’t collect metrics | 0% ( 3) |
| Other (please specify) | 3% ( 25) |
We have see that 74% of respondents specified Performance analysis as a reason for collecting metrics. Below that 63% of respondents specified that they used metrics for Fault detection. It is indeed interesting to see that, whilst Performance analysis is still the leading reason for metrics collection, that Fault detection comes a close second.
I also summarized the Other responses as a table excluding what appeared to be one invalid response.
| Metrics Purpose - Other | Count |
|---|
Retrospective problem debugging | 5Capacity planning | 4Collect, but don't use at this point | 4Security/Malware | 3Business intelligence | 3SLA data presented to clients | 2KPI | 1Hardware issues | 1Netflow | 1I was surprised by the small number of people who collect and do not use. I had expected more people to do this.
Footnotes
-
We have a minor anomaly of 3 respondents whose surveys seemingly did not skip them to the next question. ↩