A bit of a Vector
I’m always looking at new monitoring and logging tools. I’ve written some books on logging and some that feature logging as part of broader monitoring frameworks.
Recently I’ve been playing around with Vector. Vector describes itself as an observability tool, specifically a “data router”, but has a heavy focus on logs as data sources, although it also supports metrics and has indicated tracing data is a future ambition.
The Vector team see it as a replacement for Logstash, Telegraf, Fluent et al but warn that it is not a distributed stream processing tool (or a replacement for Kafka! hellz) nor that it should be used with analytics-type data.
Vector is written in Rust, because of course it is being the trendy new language for infrastructure tools. It has been released under the Apache 2.0 license by the team at Timber.io as the open source end of their SAAS monitoring tool.
Vector architecture
Vector’s architecture is based around building pipelines. Pipelines take incoming events, perform any transformation you may want on the events, and output them to some destination. Each of these pipelines are made up of three components, articulated here in the progression they are typically used.
- Sources - These are what Vector gets data from, which is subsequently normalized into an event record. Sources include classics like Syslog, pulling from files, or receiving data on a TCP connection.
- Transforms - These modifies events or a stream of events. This could include parsing or filtering events, doing sampling or aggregating events; essentially anything that modifies an event.
- Sinks - Are the final destinations of our events. Each sink sends to a different destination, for example streaming events to a TCP socket or sending events for storage in AWS S3.
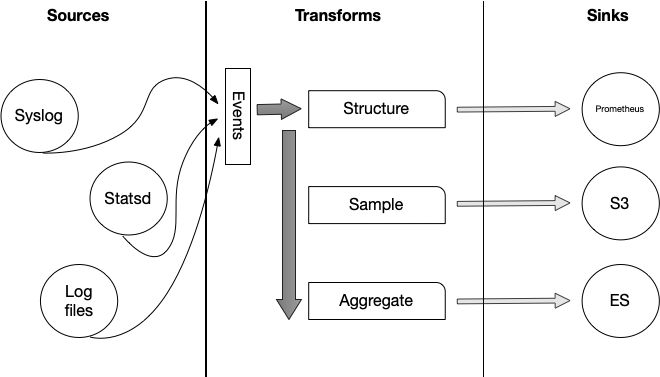
If you’re coming from the Logstash world the easiest comparison here would be sources are inputs, transforms are filters, and sinks are outputs.
Let’s take a look at Vector now.
Installing Vector
Vector is available as binary and package installers for a variety of Linux distributions, Windows, and OS X in a variety of flavors (Tarball, DMG, DEB, RPM, etc) and as a Docker image.
You can download the binary or package of your choice from here. I’m going to install a DEB package on an Ubuntu host for my local testing.
$ wget https://packages.timber.io/vector/0.9.1/vector-amd64.deb$ sudo dpkg -i vector-amd64.debThis will install the Vector binary, vector, to /usr/bin, some sample configuration to /etc/vector, and service management setup to run Vector as a service.
Configuring Vector
Now we’ve got it installed, let’s run the vector binary.
$ vectorMay 18 11:07:17.177 INFO vector: Log level "info" is enabled.May 18 11:07:17.177 INFO vector: Loading configs. path=["/etc/vector/vector.toml"]May 18 11:07:17.180 INFO vector: Vector is starting. version="0.9.1" git_version="v0.9.1" released="Thu, 30 Apr 2020 15:51:58 +0000" arch="x86_64"May 18 11:07:17.181 INFO vector::topology: Running healthchecks.May 18 11:07:17.181 INFO vector::topology: Starting source "in"May 18 11:07:17.181 INFO vector::topology: Starting sink "out"May 18 11:07:17.181 INFO vector::topology::builder: Healthcheck: Passed.May 18 11:07:17.181 INFO source{name=in type=stdin}: vector::sources::stdin: Capturing STDINWe’re running Vector interactively and its default configuration behavior is to capture STDIN. Let’s type something into STDIN and see what happens.
May 22 12:43:35.788 INFO source{name=in type=stdin}: vector::sources::stdin: Capturing STDINThis is a testThis is a testWe’ve typed This is a test and seen it echo’ed in the console.
Let’s see how this was achieved in the default configuration shipped with the Vector package. Vector’s configuration is contained in /etc/vector/vector.toml. The .toml file extension indicates the project is using the TOML configuration format. The default configuration looks like this:
#                                    __   __  __#                                    \ \ / / / /#                                     \ V / / /#                                      \_/  \/##                                    V E C T O R#                                   Configuration## ------------------------------------------------------------------------------# Website: https://vector.dev# Docs: https://vector.dev/docs/# ------------------------------------------------------------------------------
# Note: A full config spec is located at ./vector.spec.toml and examples#       in the ./examples folder.
data_dir = "/var/lib/vector"
# Input data. Change me to a valid input source.[sources.in]  type = "stdin"
# Output data[sinks.out] inputs = ["in"] type = "console" encoding = "text"The configuration file specifies the location of the Vector data directory, using the data_dir variable. It also specifies a source and a sink. We name our sources and sinks, prefixing them to identity the type and specifying a name after the period. The type inside our source and sink tells Vector what that component is, for example stdin for a source that consumes standard input.
Our sink, sinks.out, is of the type console, which outputs events to the console.
[sinks.out]. . . type = "console". . .In our configuration, the sources.in input source is tied to an output via the inputs variable.
[sinks.out] inputs = ["in"]. . .The variable is an array so you can tie multiple sources to a sink, so we could send events from the sources.in source and other sources to the sinks.out sink by specifying another entry in the inputs array. This allows you to create pipelines in Vector where events flow from sources, through transforms, and out via sinks.
The encoding variable specifies how the event will be outputted, in our case the output will be in the form of plain text.
Let’s create a new source, monitoring a log file on our host,
[sources.in]  type = "stdin"
[sources.auth]  type = "file"  include = ["/var/log/auth.log"]
# Output data[sinks.out]  inputs   = ["in", "auth"]  type     = "console"  encoding = "json"
This adds a new sources.auth source with a type of file. It uses the include variable to specify an array of files to monitor. We’re monitoring the Ubuntu authentication log file: /var/log/auth.log.
We’ve added our new source to the sinks.out sink in the inputs variable. We’ve also changed the sink’s encoding to JSON-formatted events.
Let’s restart Vector, this time running it with sudo to give us read access to the /var/log/auth.log file.
$ sudo vector. . .May 23 03:54:43.503 INFO vector::topology: Starting source "auth"May 23 03:54:43.503 INFO vector::topology: Starting sink "out"May 23 03:54:43.504 INFO vector::topology::builder: Healthcheck: Passed.May 23 03:54:43.504 INFO source{name=in type=stdin}: vector::sources::stdin: Capturing STDINMay 23 03:54:43.504 INFO source{name=auth type=file}: vector::sources::file: Starting file server. include=["/var/log/auth.log"] exclude=[]May 23 03:54:43.505 INFO source{name=auth type=file}:file_server: file_source::file_server: Found file to watch. path="/var/log/auth.log" file_position=74406571{"file":"/var/log/auth.log","host":"pelin.example.com","message":"May 23 03:54:15 pelin sudo: pam_unix(sudo:session): session closed for user root","source_type":"file","timestamp":"2020-05-23T07:54:43.511162890Z"}{"file":"/var/log/auth.log","host":"pelin.example.com","message":"May 23 03:54:16 pelin sshd[10972]: Failed password for invalid user kvl from 165.169.241.28 port 48492 ssh2","source_type":"file","timestamp":"2020-05-23T07:54:43.511255642Z"}We can see that JSON-formatted events from the SSH daemon are being collected and emitted from Vector.
{"file":"/var/log/auth.log","host":"pelin.example.com","message":"May 23 03:54:16 pelin sshd[10972]: Failed password for invalid user kvl from 165.169.241.28 port 48492 ssh2","source_type":"file","timestamp":"2020-05-23T07:54:43.511255642Z"}The JSON-encoded events contain the source and source type of the event, the host, and the message.
We can make use of the last Vector component, transforms, to parse or edit events. Here’s an example of a transform that uses Logstash’s grok parsing to process Syslog-style events.
[transforms.syslog]  type = "grok_parser"  inputs = ["auth"]  drop_field = true  field = "message"  pattern = "%{SYSLOGBASE} %{GREEDYDATA:message}"
[sinks.out]  inputs   = ["in", "syslog"]  type     = "console"  encoding = "json"
We can see our new transform, transforms.syslog, with a type grok_parser. Like our sources and sink, we tie transforms together as part of a pipeline using the chained inputs variable. We use the auth source as the value of the inputs variable in the transform. This ensures only events from that source are processed. Our parser uses the regular expression in pattern on the message field, in our case it parses using the default grok Syslog primitives and then grabbing the rest of the message. We then drop the original message field. Finally, we update our sink to receive the processed events from the transform.
When we restart Vector, we’ll see the processed events after they are parsed by our transform.
$ sudo vector. . .{"facility":"","file":"/var/log/auth.log","host":"pelin.example.com","logsource":"pelin","message":"pam_unix(sshd:auth): authentication failure; logname= uid=0 euid=0 tty=ssh ruser= rhost=112.30.125.25","pid":"26447","priority":"","program":"sshd","source_type":"file","timestamp":"May 24 00:11:57"The transform has broken the original message into fields, extracting the useful information out of the standard Syslog message.
Conclusions
Vector is definitely interesting. It doesn’t quite have the scope of components/plug-ins that the ELK stack already has but inclusions like the grok_parser provide a lot of power. I’m not a huge fan of TOML configuration at the best of times but it’s workable. I’m also impressed with the ability to type, and coerce, types onto fields in configuration. The documentation is detailed albeit a bit rough in places and I stumbled on a couple of regressions and inconsistencies. Another of the interesting things Vector brings to the table is a unit test framework. I’m fascinated to try out some unit tests of logging and parsing configuration.
Overall, Vector is definitely worth taking for a spin. Testing a Rust-based processor for performance, especially against the slightly heavier weight JRuby of Logstash, would be an interesting exercise. I was able to throw a moderate load at Vector (10,000 events/sec), which it handled easily, but that’s definitely not the scale of some of my ELK implementations. I’m curious to see how it handles larger and more complex workloads.